
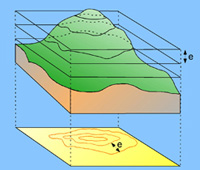
The terrain S of a region can be viewed as the graph of a function of two variables x and y, defined as follows: represents the altitude of point on S, whose orthogonal projection onto the horizontal plane at sea level is . An accurate picture of S can be drawn on a sheet of paper using a familiar cartographic technique for representing topographic surfaces. One need only draw a few contour lines on a map of the region: these are the projections onto the plane of the curves in which S intersects horizontal planes. The difference in altitude between successive horizontal planes is often chosen to be constant.
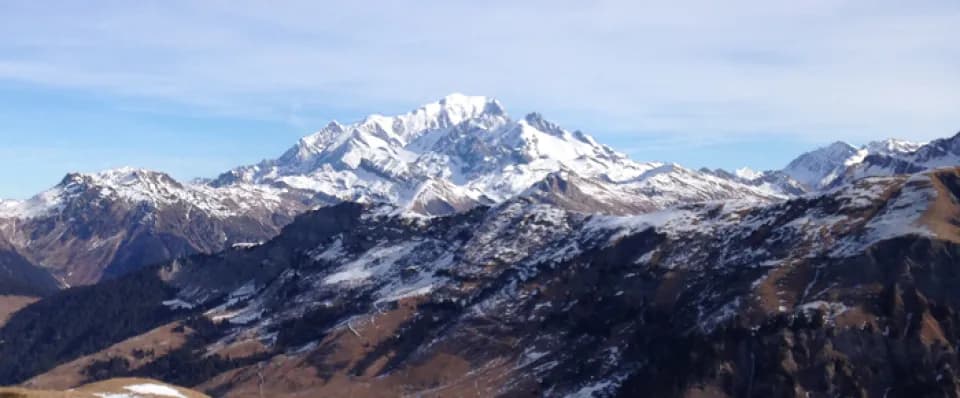
Where is Mont Blanc?
----------------------------
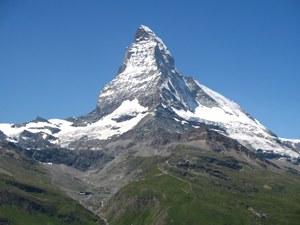
Let's explore a mountainous area with a single peak, such as the area around the Matterhorn. In such a landscape, the contour lines are nested closed curves whose elevations increase as their lengths decrease. The closer together the contour lines are, the steeper the mountainside. The summit corresponds to the "center" of the contour lines.