


Whatever field they work in, statisticians often seek patterns and similarities among the individuals under study, in order to simplify a population by dividing it into homogeneous groups: groups of consumers with similar behavior in marketing, classification of images or image regions in medical imaging, detection of topics in a large corpus of newspaper articles…
One approach is to work directly from the data and find the "most similar" individuals (see, for example, the K-means method in the article "Automatic classification"). Another is to analyze the data using a statistical model (see box), which accounts for the fact that an observed population actually comes from several different subpopulations that have been mixed together: this is a mixture model.
Modeling and clustering
----------------------------
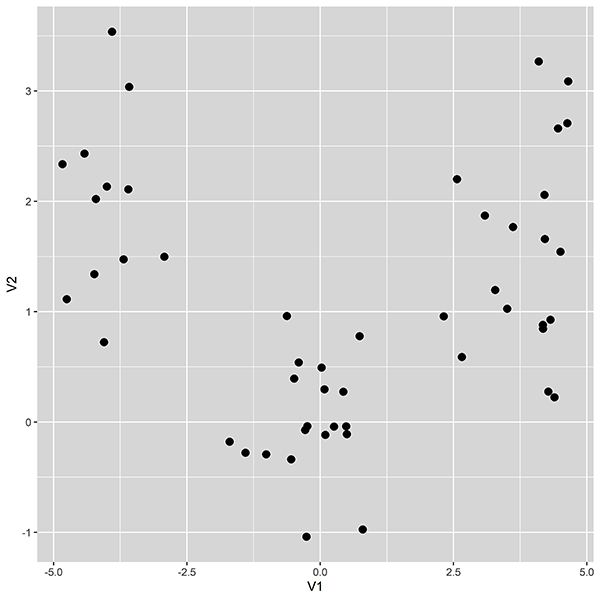
Consider the data in the figure below. If the individuals represented by the points were randomly selected from a population, these data form an independent and identically distributed sample of n two-dimensional observations (age and income, for example), x1 ∈ ℝ2, *x 2 ∈ ℝ2… *xn* ∈ ℝ2.