



Buffon was a naturalist with a monumental body of work. His forty-four-volume Histoire naturelle, générale et particulière was published over the course of the Age of Enlightenment. He was also a writer and a versatile scientist. In 1733, he presented the Académie des sciences with a paper on a coin-toss game that attracted considerable attention. In it, he considered several games of chance in which the probability of winning involved geometric quantities. Until then, calculations involving card and dice games had relied on discrete quantities. Buffon's aim was "to restore Geometry to its rightful place in the science of chance".
To do so, he considered games of a "geometric" nature. The first was a coin-toss game played on a tiled floor. The floor is tiled with equal squares of side length a. A coin is tossed onto the floor, and the question is how likely it is to land entirely within a tile, without touching an edge. To win, the center of the coin, assumed to be a disk of radius r, must therefore lie in a smaller square of side a – 2r.
|  |  |
|---|---|
| A winning outcome for the player: the coin has landed cleanly within a tile. | A losing outcome for the player: the coin straddles two tiles. |
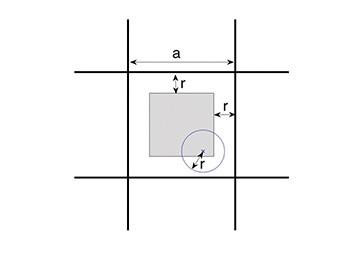
The gray square is the region in which the center of the coin
must lie to win the clean-tile game.
The player's probability of winning is therefore the ratio of two areas: that of the small gray square to that of a tile. It is (a – 2r)2 / a2. Buffon then deduced the diameter d the coin must have for the game to be fair: d must equal
or approximately 0.29a.
Buffon's needle
The second game Buffon considered involved tossing a needle onto a wooden floor. This experiment is now commonly known as Buffon's needle problem. In this game, a needle—modeled as a line segment with half-length l—is tossed onto a floor made of boards of width a (greater than l). The boards are assumed to be infinitely long, and Buffon considered the probability that the needle crosses a boundary between boards. Once again, he showed that this probability can be expressed as a ratio of two areas: the area representing favorable outcomes to that representing all possible outcomes.
|  |  |
|---|---|
| A winning outcome for the player: the needle does not cross any joint between the floorboards. | A losing outcome for the player: the needle crosses a joint. |
The needle is specified by a number y between 0 and a (measuring the distance from the center of the needle to the upper edge of the board on which it lies) and by the angle α between the needle and the horizontal (the direction of the boards).
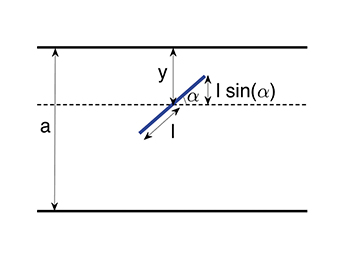
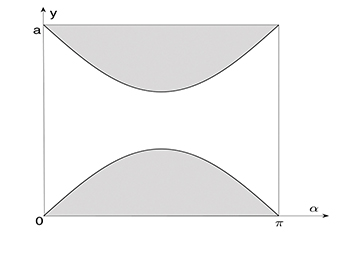
The region in gray contains the potentially losing outcomes for the player.
The needle crosses a board boundary if y < l sin α (in which case it crosses the upper edge of the board) or y > a – l sin α (in which case it crosses the lower edge). The crossing probability is therefore the ratio of two areas: that of all favorable pairs (y, α) to that of all possible pairs (y, α). The former region (shown in gray in the figure) is bounded by two arcs of sine curves, and its area can be calculated using an integral. Thus, the crossing probability is the gray area divided by the area of the rectangle, namely
which equals
With these two examples, Buffon showed how geometry and probability can interact, marking the birth of a branch of mathematics known as stochastic geometry. The underlying idea is to calculate probabilities involving geometric objects such as points, line segments, lines, disks, and so on. It is a highly active field, both in theory and in its applications.
At the end of his paper, Buffon observed that many questions could be solved by similar calculations:
> "These examples suffice to convey an idea of the games that may be devised from ratios of extent; many other questions of this kind might be posed that would be both curious and even useful: one might ask, for example, how great a risk one runs in crossing a river on a plank of varying width; how much one should fear lightning or a falling bomb; and many other problems of conjecture in which only ratios of extent need be considered, and which consequently belong just as much to Geometry as to Analysis."
Bertrand's paradox
As Joseph Bertrand emphasized in his book Calcul des probabilités (Gauthier-Villars, 1889): "The probability of an event is the ratio of the number of favorable cases to the total number of possible cases. One condition is implicit: all cases must be equally possible."
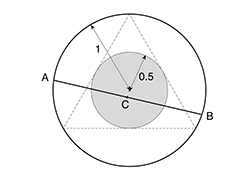
Bertrand then proposed a small "elementary" probability problem about a chord in a circle. This little problem, known as Bertrand's paradox, produces different results depending on how it is approached. The question is this: what is the probability p that a random line intersecting a circle of radius 1 cuts off a chord [AB] longer than (the side length of an equilateral triangle inscribed in the circle)? At least three different lines of reasoning are possible.
First line of reasoning: after rotating the figure if necessary, we may assume that A is fixed. Point B must then lie on the arc opposite A, so the probability is 1/3.
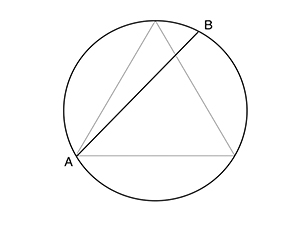
First line of reasoning: p = 1/3.
Second line of reasoning: after rotating the figure if necessary, we may assume that chord [AB] is horizontal. It must then lie at a distance of less than 1/2 from the center, so the probability is 1/2.
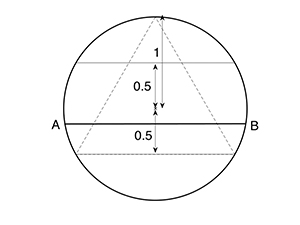
Second line of reasoning: p = 1/2.
Third line of reasoning: the center of the chord, denoted by C, must lie inside a disk (shown in gray in the figure) whose radius is half that of the large circle. The required probability is therefore the ratio of the area of the large disk to that of the small disk, namely 1/4.
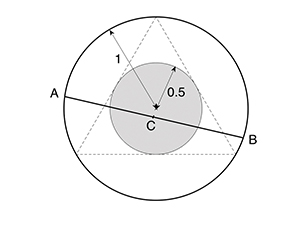
Third line of reasoning: p = 1/4.
Choosing a line at random
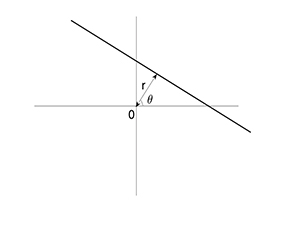
What is the "right" answer? And why do the three lines of reasoning produce three different results? It all comes down to the phrase "choosing a line at random." To define this notion properly, we must first consider how lines are represented. A line D is usually specified as the set of all points with coordinates (x, y) satisfying an equation of the form ax + by + c = 0; the coefficients a, b, and c define D. This description is not unique: for example, a, b, and c may be replaced respectively by 2a, 2b, and 2c without changing D. There is, however, another representation of D that can be described as "canonical." We represent D by two parameters: θ (the angle between the horizontal and the perpendicular drawn from O to the line) and r (the distance from the line to the origin O of the coordinate system). D then consists of all points (x, y) in the plane satisfying the equation x cos (θ) + y sin (θ) – r = 0. With this correspondence between a "point (θ, r)" and a "line in the plane," choosing a line at random is equivalent to choosing a point (θ, r) at random.
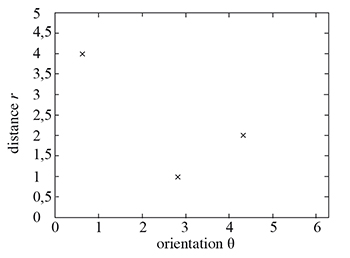
Choosing pairs (θ, r) at random.
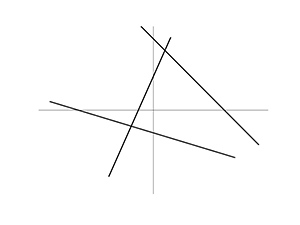
Corresponding lines.
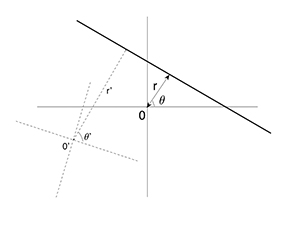
Thus, the set of lines satisfying a given property P corresponds to a region U(P) in the (θ, r)-plane. The (θ, r)-parameterization is a natural choice because it is the only representation that guarantees invariance under translation and rotation. If we change the coordinate system by moving O and rotating the axes, then for every property P, the measure (or area) of U(P) equals that of U’(P), where U’(P) denotes all points (θ’, r’) representing, in the new coordinate system, the lines that also satisfy P.
As an example, consider the property "intersects a disk of radius R." By translation invariance, we may take the disk to be centered at O and to have radius R. The set E of points (θ, r) for which the line D with parameters θ and r intersects the disk is then a rectangle whose sides have lengths 2π and R, respectively. The measure of E is therefore the area of this rectangle, namely 2π R, which is also the perimeter of the disk.
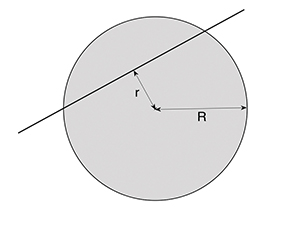
.jpg)
This example gives us "the solution" to Bertrand's paradox: the probability that chord [AB] exceeds the specified length equals the probability that a line intersecting the large disk of radius 1 also intersects the small disk of radius 1/2. This probability is the ratio of the perimeter of the small disk to that of the large disk (not the ratio of their areas, as in the proposed third line of reasoning!). Thus, "the right" answer is p = (2π × 0.5) / (2π × 1), or p = 1/2.
In fact, this result generalizes further: one can show that the measure of all lines intersecting a convex set K is equal to the perimeter of K.
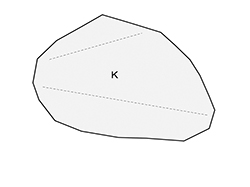
A set K is convex if, whenever any two points inside K are chosen, the entire line segment joining them lies within K.
In stereology…
The applications of stochastic geometry draw on theoretical developments, but the converse is also true: questions arising from certain applications lead to new theoretical developments. This is the case in stereology, whose aim is to obtain information about an unknown two-dimensional object from measurements of its one-dimensional sections.
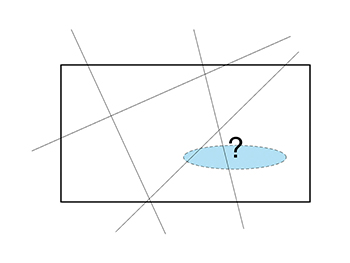
Imagine a rectangle containing an unknown object K. Suppose we choose random lines through the rectangle, recording only whether each line intersects the object. We can then determine the probability that a random line intersecting the rectangle also intersects K. But this probability is equal to the ratio of the perimeter of K (assumed to be convex) to the perimeter of the rectangle! This principle is widely used in materials science because it allows geometric characteristics of the object, such as its perimeter, to be determined.
In a different vein, computer-generated imagery offers a perhaps more unexpected application of stochastic geometry. Instead of tossing a needle, we can scatter small images representing a pattern. If many copies of the same pattern are scattered over a large surface, then after normalization by the mean and variance, the central limit theorem yields a large image known as a texture image. Such images are widely used in animated films and video games, where computer-generated scenery such as skies, grass, sand, marble, and fabric must be produced.
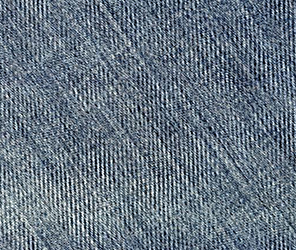

Such a process—which is equivalent to "filtering" noise with a suitably chosen filter—enabled Ken Perlin, a professor in New York University's computer science department, to win a technical Academy Award in Hollywood in 1997 for his method of procedural texture synthesis.
Beyond these examples, image synthesis is also very useful in medicine for modeling and understanding images of biological tissue
---
This text is drawn from a lecture given by Agnès Desolneux on Wednesday, April 26, 2017, at the Bibliothèque nationale de France as part of the "One Text, One Mathematician" series. Agnès Desolneux is a CNRS senior researcher at the Centre de mathématiques et leurs applications of the École normale supérieure.