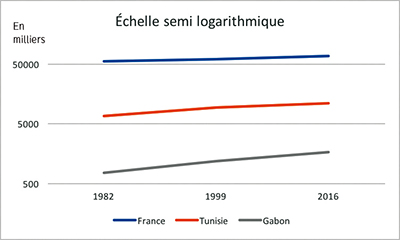




Semilogarithmic scales
--------------------------------
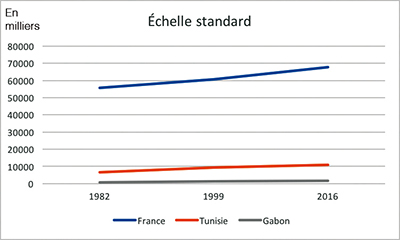
Suppose we want to compare population changes across several countries. France and Gabon, for example, have vastly different populations. We plot the census years on the x-axis and population on the y-axis. With an ordinary coordinate system, the curve representing Gabon's population will be flattened against the x-axis, making any changes imperceptible.
To make the data easy to read, we use a logarithmic scale on the y-axis, so the distance from one hundred thousand to one million is the same as that from one million to ten million. The slopes of the line segments forming each curve then represent relative rather than absolute growth.