



BMI nomograms
-----------------
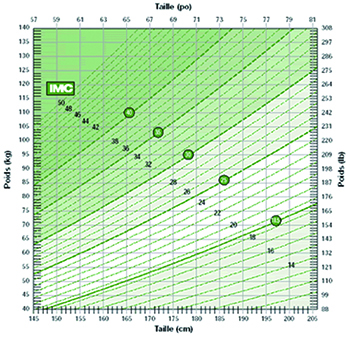
It is important for one's health to keep a stable weight close to an equilibrium weight, which is estimated based on height. A body mass index (BMI) can be calculated; it was introduced by the Belgian statistician Adolphe Quetelet (see page 14). The structure of this index can be presented in the form of a nomogram. The term, which covers a set of graduated curves each associated with its own measurements, was introduced by the French mathematician Maurice d'Ocagne (1862-1938) with the aim of promoting graphical methods for solving algebraic equations. For BMI, individuals' heights (in cm) are plotted on the x-axis, and their weights (in kg) on the y-axis, and the family of curves giving the same BMI is then drawn. In the plane, the resulting figure consists of portions of parabolas: by definition of the index, on each curve the weight is proportional to the square of the height. The graphical determination of a person's BMI is straightforward: plot the point whose coordinates are the height on the x-axis and the weight on the y-axis. The number associated with the curve closest to that point is then read off — ideally, the BMI should fall between 18 and 25!
-
Farmer curves
-----------------