


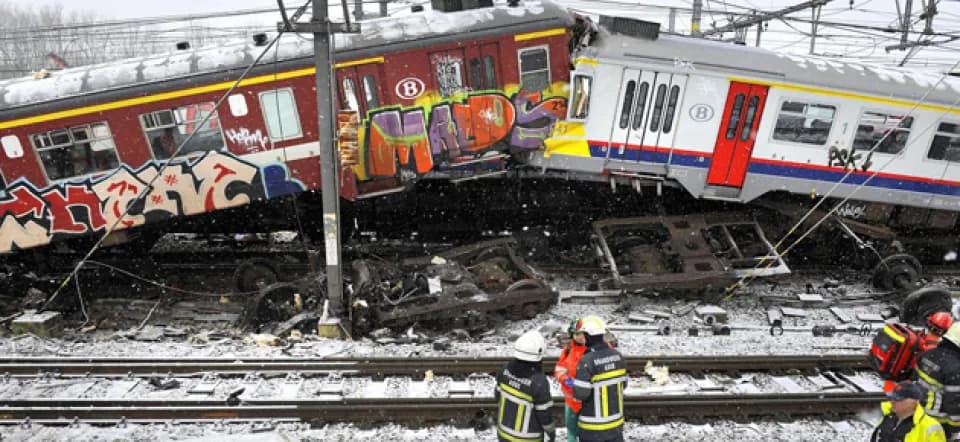
On January 15, 2019, the free Belgian daily metro ran a huge, bold front-page headline proclaiming: "Rail network safer." The public no doubt needed reassurance, as it was once again reeling from the Buizingen disaster, which had killed nineteen people and injured more than 150 on February 15, 2010... and whose trial had just begun, nine years after the event! The press had just revisited the circumstances of the accident, complete with grisly details. A short article following the headline's optimistic claim set out the facts behind it. It read, word for word: "Of the approximately 1.3 million trains that travelled on Belgium's rail network, 87 passed a red signal in 2018, compared with 55 in 2017, according to Infrabel [the Belgian railway network's infrastructure manager, Ed.]. However, the proportion of dangerous red-signal violations fell from 34.5% in 2017 to 27.6% in 2018." What can we conclude from these figures?
To begin with, only the final statement—the fall in the rate of dangerous red-signal violations—was used to craft the headline, since the other figures offered no real grounds for optimism...
Next, we find that the figures provided are of two kinds: absolute figures for the number of red-signal violations and relative figures for those described as "dangerous". This alone should set alarm bells ringing. Comparing results measured in different ways is always suspect. A simple calculation shows why. We need to count the dangerous violations. This number rose from 19 (that is, 55 × 0.345) in 2017 to 24 (that is, 87 × 0.276) in 2018—an increase of five, or more than 26% in relative terms! So was the rail network really safer?
Error analysis
--------------------------
There is another point to note: the article's presentation of the data completely disregards significant figures. The violation rates are given to three decimal places, suggesting precision to the nearest thousandth. Yet the number of dangerous violations is around 20, out of fewer than 100 in total. The slightest change in the criteria used to determine whether a violation is dangerous can therefore cause the number to fluctuate substantially. In 2017, for instance, one fewer dangerous violation would have changed the rate from 0.345 to 18 / 55, or 0.327—a fluctuation of almost 2%. Similarly, one additional violation would have raised the rate to 20 / 55, or 0.364. In this context, given the subjective nature of "dangerousness" (which the article does not define), what does the third decimal place mean?