




The Lorenz curve L
--------------------------
To describe income inequality, the American economist Otto Lorenz, then aged 29, introduced in 1905 the curve that now bears his name. For a population and a variable relating to it, income for example, the Lorenz curve maps the share x of the poorest households to the percentage y of total income they receive. This gives a curve equal to 0 at 0, 1 at 1, and lying below the first bisector (the line with equation y = x). After all, the total income of the poorer half of the population is less than half the total income!
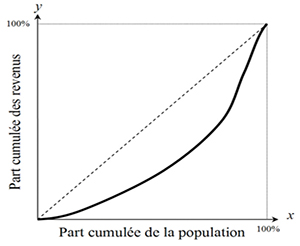
This curve shows how income is distributed between the poor and the rich. The further the curve moves away from the first bisector, the more unequal the distribution of income. Conversely, with a perfectly equal distribution, the curve would coincide with the bisector.
In fact, to plot the Lorenz curve, incomes have to be split into progressive income brackets; this yields a polygonal line, which is a good approximation.