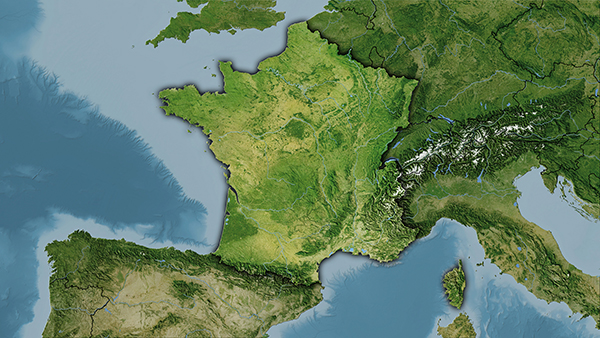




In the second half of the 18th century, France had eighty bookseller-printers specializing in mathematics, distributed as follows: 3 in Avignon, 1 in Chaumont, 1 in Épinal, 1 in Grenoble, 1 in Lyon, 1 in Marseille, 1 in Montpellier, 66 in Paris, 1 in Rouen, 2 in Strasbourg and 2 in Toulouse. How can we best visualize these data? With Khartis! Load the data into a spreadsheet file (CSV, for comma-separated values):
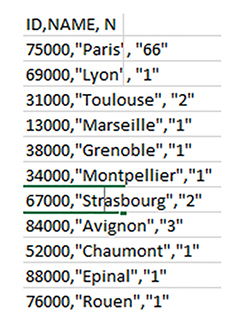
Next, download Khartis or use it online (**sciencespo.fr/cartographie/khartis**), import your own base map, then your data (our CSV file here), to produce the visualization below.
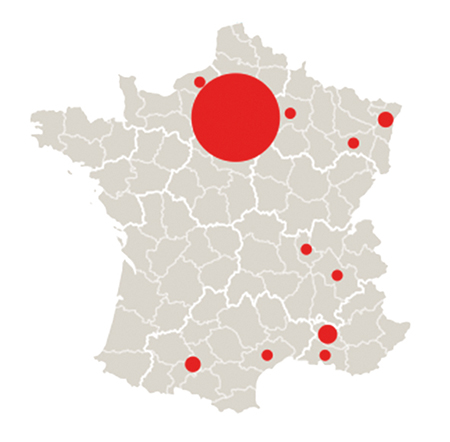
A range of options lets you choose colors, variables and maps, and insert text…