



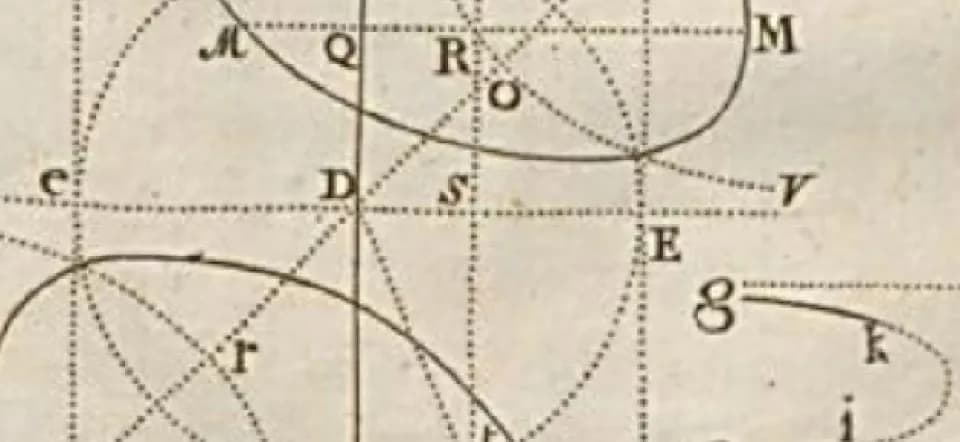
How were algebraic curves studied and plotted in the mid-18th century, beyond plotting them point by point?
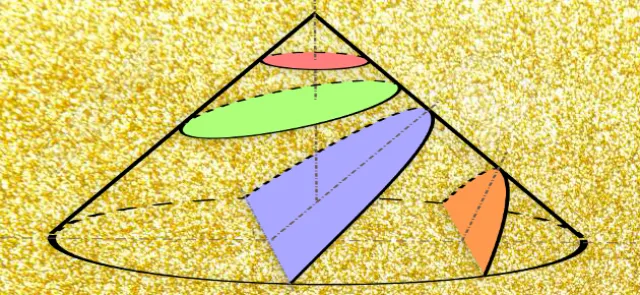
By 1750, when the Introduction à l’analyse des lignes courbes algébriques was published, geometers had thoroughly mastered conic sections, which had been studied since antiquity.
These curves, whose general Cartesian equation has the form Ax2 + Bxy + Cy2 + Dx + Ey + F = 0, are of degree 2.( For expressions of the form xn ym, the sum n + m is at most 2.)
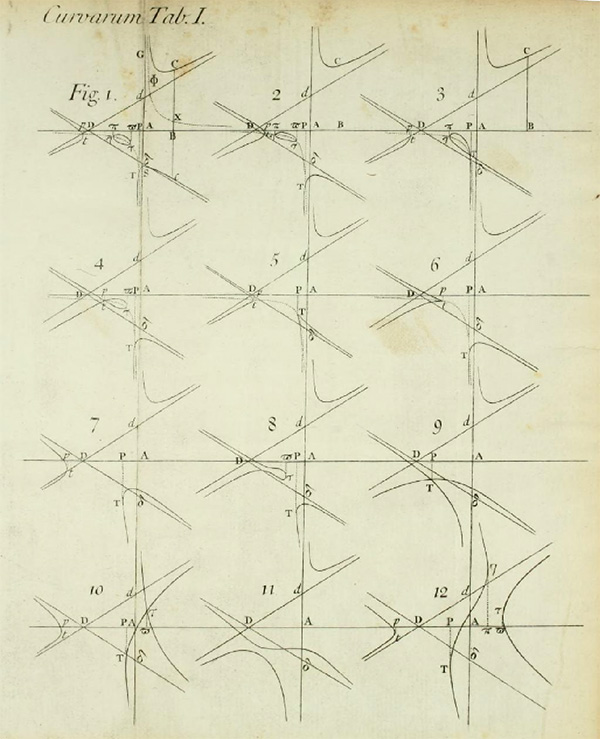
Mathematicians were also interested in cubic curves—that is, curves of degree 3—which they had classified following the research of Isaac Newton (1642–1727). After reducing the general cubic equation to four canonical equations, Newton proposed a classification of 72 distinct types (later expanded to 78), whose shapes were carefully plotted on six plates that are a delight to examine (see below).