



Imagine a large data table: individuals (or observations) are arranged in rows, while the columns contain variables that characterize them. The table is large, with many rows. It might also have many columns, but that is not our immediate concern. And you have no a priori knowledge of how the observations are structured.
Groups of points
---------------------
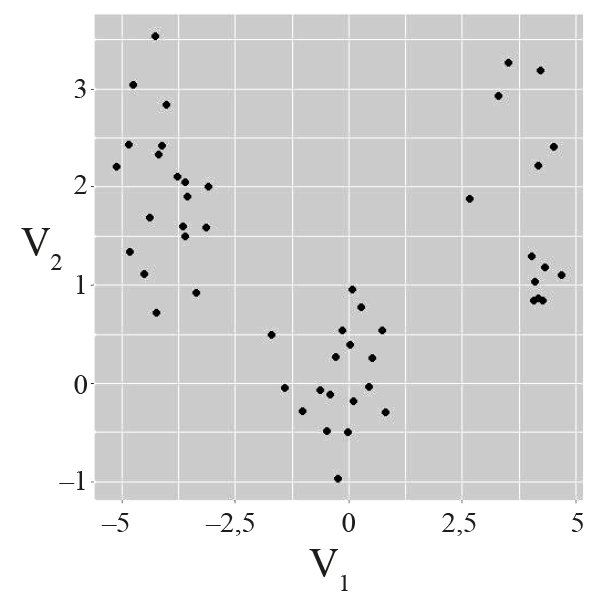
For simplicity, suppose the table has only two columns, corresponding to two quantitative variables (that is, measurable variables), called V1 and V2. Each observation is therefore a point in ℝ2. To gain a clear understanding of these data, we can summarize each variable (mean, standard deviation) and plot them, with V1 on the x-axis and V2 on the y-axis.
The top example reveals something particularly interesting: three very distinct groups are visible. In the bottom example, by contrast, everything appears to form a single cluster. The middle example lies somewhere in between: three groups could be defined, but their boundaries are unclear.