



Cholera, endemic to India, eventually reached Europe seven times during the 19th century, in what became known as the seven cholera pandemics. During the second pandemic, in 1832, London doctor John Snow contracted cholera while treating underground miners. He then began to doubt the miasma theory, which held that the disease spread through the air (Koch's bacillus would not be discovered until fifty years later), and considered water a vehicle for transmission.
Snow tried to confirm his hypothesis during the next outbreak, in 1848, by conducting "the grand experiment". He found that residents supplied by a company drawing its water directly from the Thames were more likely to be infected than those supplied by a company drawing from an aquifer.
The 1854 outbreak allowed him to refine his study by mapping cholera deaths in Soho (the black bars in the figure), a district served by thirteen water pumps (blue dots). The task was then to determine each pump's area of influence.
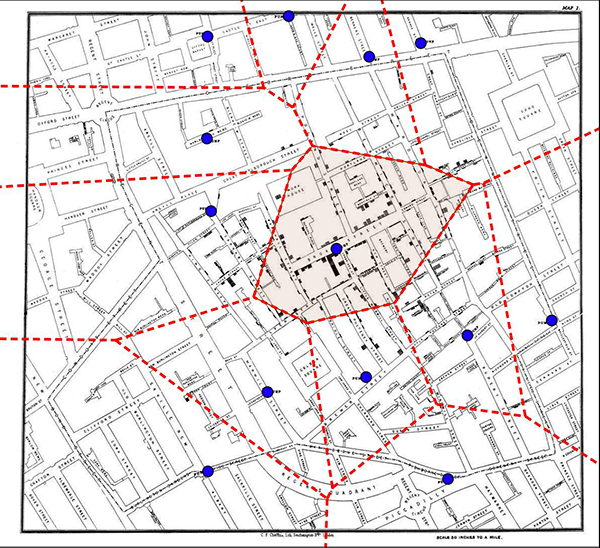
Since each of the two regions into which the perpendicular bisector of a line segment divides the plane consists of the points closest to one of that segment's endpoints, the perpendicular bisectors are drawn for every pair of nearby pumps (red lines). Snow thus obtained polygonal regions showing the area closest to each pump.
Such a tessellation is called a Voronoi diagram, after the Russian mathematician Georgy Feodosevich Voronoi (1868–1908). Since the cell associated with the Broad Street pump had the highest density of deaths (the colored polygon), John Snow requested that the pump be closed, which led to a marked reduction in the spread of the bacillus through the district.